11.03.08
programmer productivity update
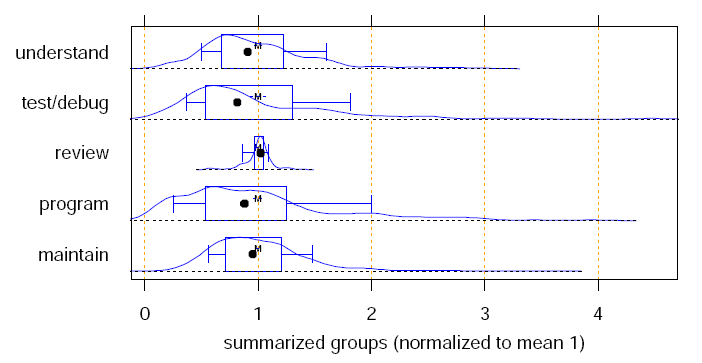
Lutz Prechelt wrote a technical report way back in 1999 that did a more rigorous, mathematical analysis of the variance in the time it takes programmers to complete one task. He finds that the distribution is wickedly skewed to the left, and the difference between the top and kinda-normal programmers is about 2. It’s nice to find supporting evidence for what I’d reported earlier. Here’s the money graph:
This graph shows the probability density — which is very much like a histogram — of the time it took people to do programming-related tasks. As this combines data from many many studies, he normalized all the studies so that the mean time-to-complete was 1.
Prechelt notes that the Sackman paper — which is the origin of the 28:1 figure that many people like to quote — has a number of issues. Mostly Prechelt covered Dickey’s objections, but he also notes that when the Sackman study was done in 1967, computer science education was much less homogenous than it is now, so you might expect a much wider variation anyway.
Evidence against my theses
As long as I’m mentioning something that came up that supports my stance, I should mention two things that counter arguments that I have made.
1. When I’m talking to people, I frequently say that it’s far more important to not hire the loser than to hire the star. My husband points out that the type of task that user studies have their users do are all easy tasks, and that some tasks are so difficult that only the star programmers can do them. This is true, and a valid point. Maybe you need one rock star on your team.
2. I corresponded briefly with my old buddy Ed Burns, the author of Secrets of the Rock Star Programmers. He is of the opinion that the rock star programmers are about 10x more productive than “normal” programmers. Interestingly, he thinks the difference is mastery of tools. I think this is good news for would-be programming stars: tools mastery is a thoroughly learnable skill.

