10.09.09
US State legislators’ affiliations
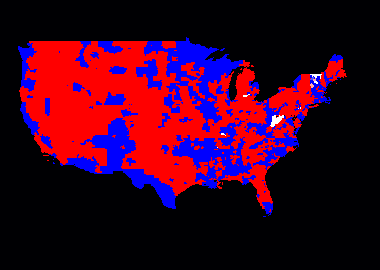
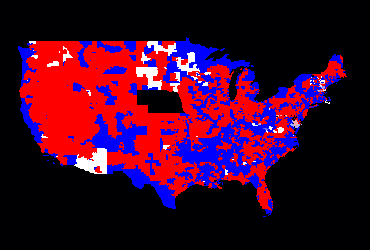
I have two more political layers up on my political/demographic map: US state senators and US state representatives (or assemblymembers, as they are called in some states). Alaska and Hawaii didn’t fit nicely on these images, but you can see them on the political/demographic map.
In the pictures below (and on my site), red is Republican; blue is Democratic. (To those outside the US who are used to red meaning liberal, the US does its colours backwards, sorry.) Some districts elect multiple members; in those cases I average the colour, with exact Democratic/GOP balance being white. In cases where there is a vacancy or a third-party affiliation, the colour is also white.
Here are the state senators:

Continental US State Senator Party Affiliation
Below is the party affiliation of the lower chamber members (which are usually called Representatives, but also sometimes Assemblymembers or Delegates). Note that Nebraska doesn’t have a lower chamber.

Continental US State Lower Chamber Members' Party Affiliation
Most of the party affiliation data came from the excellent Project Vote Smart. What they didn’t have, I gleaned from the appropriate state legislature’s page, Wikipedia, or both.
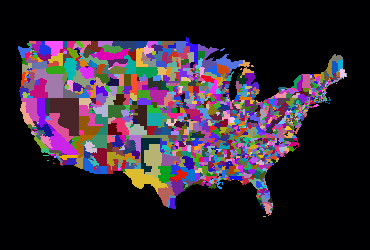
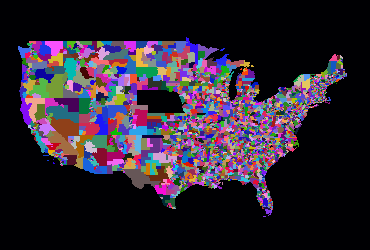
For comparison, the images below show all the districts in the continental US in random colours:

Continental US State Senate Districts

Continental US State Lower Chamber Districts
There are almost 8000 state and federal legislators in the US for a population of 300M people, or about one legislator per 375,000 people. The number of legislators varies wildly by state, however. New Hampshire currently has 424 state and federal legislators representing a population of 1.3M, or one legislator for every 3066 people. California currently has 176 representing a population of 36M, or one legislator for every 204,000 people.

John Dougan said,
October 11, 2009 at 10:45 pm
Do you have any idea how and when the US managed to get the colors backwards? I know from reading historical political stuff that it wasn’t always so.
admin said,
October 11, 2009 at 11:14 pm
Wikipedia has a nice article at http://en.wikipedia.org/wiki/Red_states_and_blue_states on the colours. The colours really became fixed in peoples’ minds in the 2000 election and its aftermath.
I suspect that part of why the Democratic Party ended up identified with blue and not red is because red really was tied to Communism, and Communism was a real boogyman in the US. The news outlets probably figured that if they coloured Democratic areas red, then the Democrats would accuse them of fanning partisan flames. Nobody ever accuses Republicans of being communist, so the news outlets would not have been concerned about confusion there.