03.26.12
Posted in Maps at 10:07 pm by ducky
I added a few more religious denominations to my elections/demographics site, again from Churches and Church Membership in the United States, 1990.
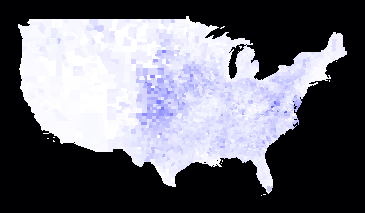
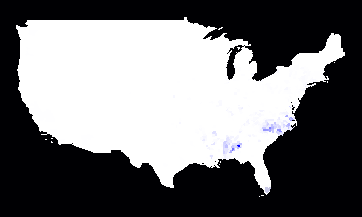
Note that these denominations have fewer adherents than the denominations I featured in my previous post, so these have full white corresponding to 0%, while full blue is 70% (vs. 100% in the previous post).
Here are adherents to the Unified Methodist Church:

% United Methodist Church Adherents 1990
I hadn’t realized that Methodists were concentrated in the center band of the country like that.
Here are the adherents to the Presbyterian Church (USA):

% Presbyterian Church USA Adherents 1990
I was surprised at how diffuse the Presbyterians are.
Here is the African Methodist Episcopal Zion adherents:

% African Methodist Episcopal Adherents 1990
I was surprised at how concentrated the AMEZ church was — in North Carolina and Alabama.
Permalink
03.25.12
Posted in Maps at 12:42 am by ducky
I recently added some data from Churches and Church Membership in the United States, 1990 to my election/demographics map. Collected by the Association of Statisticians of American Religious Bodies (ASARB) and distributed by the Association of Religion Data Archives. (1990).
There is data on about 130 denominations, with number of houses of worship, number of adherents, and number of members for (almost) every one, by county. Houses of worship were surveyed, not individuals. “Adherents” is a somewhat looser criterion than “Members”, but the survey allowed the houses of worship to interpret the question as they chose. The combination of self-reporting and self-interpretation means that you probably shouldn’t pay too much attention to the raw numbers. In particular, the respondents might well be over-estimating: Joe’s Church might be counting people who went to Joe’s Church only once. However, I think the relative values across the country are interesting.
Here is the percentage of the population in the Continental US that is an adherent to any denomination (remember, as measured by the houses of worship). The more blue, the more adherents.

Adherents as a % of population
I was a little surprised at how non-churchgoing the West Coast, Florida, and Maine were.
Here is the % of the population which adheres to the Church of Jesus Christ of Latter-Day Saints (also known as “the Mormons”):

% LDS Adherents - 1990
It isn’t surprising how the concentration of LDS adherents is centered in Utah, but I was surprised at how clearly you can see the Utah state borders.
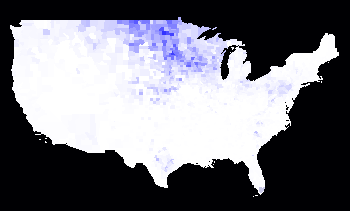
Here is the percent of the population which adheres to any of the twelve denomination with the word “Lutheran” in the name:

% Lutheran Adherents 1990
Here is a map of the percentage of the population which adheres to a denomination with the name “Lutheran” in the name. I was surprised at how concentrated the Lutherans were in the upper center of the country. I had sort of thought that a group which had a “Missouri Synod” would have significant adherents in, you know, Missouri.
Here is a map of the percentage of the population which adheres to the Southern Baptist Convention. Note that there are 25 different denomination with the word “Baptist” in it, this is just the “big one”, the Southern Baptist Convention:

% Southern Baptist Adherents - 1990
I was really surprised at how clear the state boundaries were, especially for Missouri and Kansas. I guess I kind of knew that the Southern Baptist Convention was sort of the religion of slavery, but I hadn’t realized just how long the geographical connection would persist. (The Southern Baptist Convention split off from the northern branch in 1845, specifically over slavery. They did apologize in 1995.)
Here is a map of the percentage of the population which adheres to Roman Catholicism:

% Catholic Adherents 1990
I was amazed at how few Catholics there were in the Deep South. Aside from Latino influence in southern Texas and, to a lesser extent in Florida, plus the French influence in Louisiana, there are practically no Catholics in the south. (At least, not in 1990.) I grew up a few hours south of Chicago, so I rather had the impression that Catholics were ubiquitous.
I have a lot more data, but I’m not really sure what groupings make sense. For example, do I group “Holy Apostolic Catholic Assyrian Church of the East” in with “Greek Orthodox”? I have no idea if they have similar doctrines, if they hate each others’ guts, or both. Similarly, I think it would be useful to group together evangelical churches, but I’m not sure how to tell which churches are properly called “evangelical”. Stay tuned.
Permalink
03.12.12
Posted in Eclipse, programmer productivity at 9:57 pm by ducky
Several years ago, I found that differential code coverage was extremely powerful as a debugging tool and made a prototype using EclEmma. I also had some communications with the EclEmma team, and put in a feature request for differential code coverage. Actually, I thought that incremental code coverage would be easier for people to understand and use.
Well, EclEmma 2.1 just came out, and it has incremental code coverage in it! I am really excited by this, and wrote a blog post at my workplace. I have given motivation on this blog before, but I give some more on the Tasktop blog posting, as well as some instructions for which buttons to push to effectively use EclEmma to do incremental code coverage.
Permalink


