11.07.17
Posted in Technology trends at 12:10 am by ducky
I have been studying machine learning lately, and have come across three recent research findings in machine translation which have each blown my mind:
- Computers can learn the meanings of words.
- Computers can make pretty good bilingual dictionaries given only large monolingual sets of words (also known as “a corpus”) in each of the two languages.
- Computers can make sort-of good sentence-level translations given a bilingual dictionary made by #2.
Learning the meanings of words
Imagine that you could create a highly dimensional coordinate space representing different aspects of a word. For example, imagine that you have one axis which represents “maleness”, one axis that represents “authority”, and one axis which represents “tradition”. If the maximum value is 1 and the minimum 0, then the word “king” would thus have coordinates of (1, 1, 1), while the word “queen” would have coordinates (0, 1, 1), “duke” would maybe be (1, .7, 1), “president” would maybe be (1, 1, .6). (If Hillary Clinton had been elected U.S. president, then maybe the maleness score would drop to something around .8).
You can see that, in this coordinate space, to go from “woman” to “man”, or “duchess” to “duke”, you’d need to increase the “maleness” value from 0 to 1.
It turns out that it is relatively easy now to get computers to create coordinate spaces which have hundreds of axes and work in exactly that way. It isn’t always clear what the computer-generated axes represent; they aren’t usually as clear as “maleness”. However, the relative positioning still works: if you need to add .2 to te coordinate at axis 398, .7 to the one at axis 224, and .6 to the one at axis 401 in order to go from “queen” to “king”, if you add that same offset (aka vector) — .2 at axis 398, .7 at axis 224, and .6 at axis 401 — to the coordinates for “woman”, then the closest word to those coordinates will probably be “man”. Similarly, the offset which takes you from “Italy” to “Rome” will also take you from “France” to “Paris”, and the offset which takes you from “Japan” to “sushi” also takes you from “Germany” to “bratwurst”!
A function which maps words to coordinate spaces is called, in the machine learning jargon, “a word embedding”. Because machine learning depends on randomness, different programs (and even different runs of the same program) will come up with different word embeddings. However, when done right, all word embeddings have this property that the offsets of related words can be used to find other, similarly related word pairs.
IMHO, it is pretty amazing that computers can learn to encode some information about fundamental properties of the world as humans interpret it. I remember, many years ago, my psycholinguistics professor telling us that there was no way to define the meaning of the word “meaning”. I now think that there is a way to define the meaning of a word: it’s the coordinate address in an embedding space.
As I mentioned before, it’s surprisingly easy to make good word embeddings. It does take a lot of computation time and large corpuses, but it’s algorithmically simple:
- Take a sentence fragment of a fixed length (say 11) and have that be your “good” sentence.
- Replace the middle word with some other random word, and that’s your “bad” sentence.
- Make a model which has a word embedding leading into a discriminator.
- Train your model to learn to tell “good” sentences from “bad” sentences.
- Throw away the discriminator, and keep the word embedding.
In training, the computer program iteratively changes the word embedding to make it easier for the discriminator to tell if the sentence is “good” or “bad”. If the discriminator learns that “blue shirt” appears in good sentences, that “red shirt” appears in good sentences, but “sleepy shirt” does not appear in good sentences, then the program will move “blue” and “red” closer together and farther from “sleepy” in the word embedding.
Christopher Olah has a good blog post which is more technical (but which also covers some additional topics).
Computers can make bilingual dictionaries with monolingual corpuses
A recent paper showed how to make pretty decent bilingual dictionaries given only monolingual corpuses. For example, if you have a bunch of English-only text and a bunch of French-only text, you can make a pretty good English<->French dictionary. How is this possible?!?
It is possible because:
- words in different languages with the same meaning will land at (about) the same spot in the embedding space, and
- the “shape” of the cloud of words in each language is pretty much the same.
These blew my mind. I also had the immediate thought that “Chomsky was right! Humans do have innate rules built in to their brains!” Upon further reflection, though, #1 and #2 make sense, and maybe don’t imply that Chomsky was right.
For #1, if the axes of the word embedding coordinate space encode meaning, then it would make sense that words in different languages would land at the same spot. “King” should score high on male/authority/tradition in Japanese just as much as in English. (Yes, there could be some cultural differences: Japanese makes a distinction between green and blue in a different place in the colour spectrum than English does. But mostly it should work.)
For #2, language represents what is important, and because we share physiology, what is important to us is going to be very similar. Humans care a lot about gender of animals (especially human animals), so I’d expect that there to be a lot of words in the sector of the coordinate space having to do with gender and animals. However, I don’t think humans really care about the colour or anger of intellectual pursuits, so the sector where you’d look for colourless green ideas sleeping furiously ought to be empty in pretty much every language.
The way the researchers found to map one word embedding to another (i.e. how they mapped the embedding function one program found for French to one they found for English) was they made the computer fight with itself. One piece acted like a detective and tried to tell which language it was (e.g. was the word French or English?) based on the coordinates, and one piece tried to disguise which language it was by changing the coordinates (in a way which preserved the relational integrity). If the detective piece saw a high value in a word’s coordinate which didn’t have high values in English, then it would know it was French. The disguiser then learned to change the French coordinate space so that it would look more like the English coordinate space.
They then refined their results with the Procrustes algorithm to warp the shape of the embedding spaces to match. They picked some high-occurrence words as representative points (since high-occurrence words like “person” and “hand” are more likely to have the same meaning in different languages), and used those words and their translations to figure out how to bend/fold/spindle/mutilate the coordinate spaces until they matched.
Computers can translate sentences given a dictionary
The same research group which showed how to make dictionaries (above) extended that work to machine translation with only monolingual corpuses. (In other words, no pre-existing hints of any kind as to what words or sentences in one language corresponded to words or sentences in the other language.) They did this by training two different models. For the first model, they took a good sentence in language A and messed it up, and trained the model to fix it. Then once they had that, they fed a sentence in language B into a B->A dictionary (which they had created as described above) to get a crappy translation, then fed it into the fixer-upper model. The fixed up translation wasn’t bad. It wasn’t great, especially compared to a human translator, but it was pretty freakin’ amazing given that there was never any sort of bilingual resource.
When I read A Hitchhiker’s Guide to the Galaxy, I scoffed at the babelfish. It seemed completely outlandish to me. Now, it seems totally within the realm of possibility. Wow.
Permalink
08.16.14
Posted in Hacking, Random thoughts, Technology trends at 5:11 pm by ducky
There are a huge number of to-do list managers (TDLMs) out in the world now, but none of them do what I want. Apparently, it’s not just me: I just read an article which said that when students were asked what mobile apps they really wanted, 20% said they wanted “a comprehensive to-do + calendaring + life management app that helps them better organize their lives”. TWENTY percent!
Is it really that hard?
I have strong opinions about what I want, and I don’t think it’s that hard, so I will describe my desires here in the hopes that somebody will make me the perfect TDLM. (Some of the features you can see in a TDLM which I wrote for a class project. Sometimes I think about writing my perfect TDLM, but I’m busy with other things. I want it to exist, not to write it myself.)
The most important thing is that the TDLM should make you feel better about your tasks. The biggest problem with TDLMs right now is that they make you feel guilty: the list grows and grows and grows because there are an infinite number of things it would be nice to do and only a finite amount of time. This means that every time you open the TDLM, you feel overwhelmed by guilt at all the things you haven’t done yet.
1. Hide stuff you can’t work on right now because of blocking tasks. Don’t show me “paint the bedroom” if I haven’t finished the task of “choose colour for bedroom”. (This means you need UI for showing what tasks depend upon which other tasks, and I warn you that’s not as easy as you think.)
2. Hide stuff you won’t work on right now because you are busy with other things. Don’t show me “paint the bedroom” if I have decided that I’m not going to start that project until I finish doing my taxes. “Do taxes” is not truly a blocking task — it’s not like I am going to use the tax forms to apply the paint — but hide it anyway. (This means you need UI for showing what the sequencing of tasks is.)
3. Hide stuff you won’t work on right now because it is the wrong time of year. Maybe you want a task of “buy new winter jacket”, but you want to wait until the end of winter to get take advantage of the sales on coats. You should to be able to tell your TDLM to hide that task until March. (Or until May, if you live in Manitoba.) Or “rotate tires” is something which only needs to happen every six months.
Note that this implies connecting the TDLM to a calendar, at least minimally.
4. Allow recurring to-do list items. I don’t want to have to make a new task for our wedding anniversary every year. I want to set it once and forget it. Usually people put things on their calendars for repeating events, but “Wedding Anniversary” goes on August 22nd and is not a task. “Plan something for anniversary” is a recurring task but should be hidden until at about August 1st.
The TDLM should distinguish between recurring tasks which expire and those which do not. Non-expiring tasks are ones like “pay phone bill”. Even if you forget to pay it by the due date, you still need to deal with it. On the other hand, “run 2km” is an expiring item: if you couldn’t do your 2km run on Monday, it probably does not mean that you should run 4km on Wednesday.
5. Make me feel super-good about finishing tasks. A lot of TDLMs handle checking something as done by making it disappear. This is the worst. I’ve spent hours, weeks, or months looking at that dang task, and when I finally finish it, I want to savour the moment! I want my TDLM to cheer, to have fireworks explode on the screen, and maybe even have the text of the task writhe in agony as it dies an ugly painful death. I want there to be a display case in my TDLM of things that I have finished recently that I can look at with pride. “Yeah”, I can think, “I am ***DONE*** with painting the bedroom!” Maybe I don’t need full fireworks for a simple, one-step task which took 15 minutes, but if it was a 2000-step task which took 5 years (like getting a PhD or something like that), I want the TDLM to cheer for a full five minutes.
6. Let me see what I did. Sometimes, I feel like I didn’t get anything done, and it is reassuring to look at a list of the things that I actually did accomplish. It might be nice to show it in a horizontal latest-first timeline form:
- 4:47 pm Laundry
- 3:13 pm Groceries
- 12:11 pm Replace laptop display
- (etc)
I would also like to be able to modify the task completion times. “Oh, I actually finished replacing the laptop last night, I just didn’t feel like telling the TDLM because it was late and I was tired.”
7. Let me see what I am going to do. People usually use calendars for this, but as I mentioned before, calendars are kind of the wrong tool. I don’t really want to see “buy birthday present for Mom” in the same place as “Meet with boss, 10:30 AM”. Plus, a strict time-base is makes zero sense if the dependencies are other tasks.
8. Let me import/modify/export task hierarchies. Suppose you want to have a wedding. (Mazel Tov!) There are predictable things which you need to do: book a space for the wedding, a space for the reception, book an officiant, book a caterer, choose a menu, etc. If, say, you want a wedding sort of like your friend Joanne’s, it would be nice if Joanne could email you the hierarchy of tasks that she did for her wedding, and you could just drop it in to your TDLM. (Perhaps that way, you wouldn’t forget to rent a dance floor.)
But maybe you have some Greek heritage and Joanne does not, so you need to add “get a stefana” to your list. You should be able to do that — and then export your new wedding task list for your brother when he gets married. Even better, you ought to be able to upload it to a site which hosts lots of packaged tasks, maybe even a whole section on weddings (so your brother could pick and choose which wedding task list he likes best).
Needless to say, the exported task hierarchy should be in a form which lends itself well to version control and diffing. 🙂
9. Let me collaborate on tasks with other people. I would like to be able to share my “home” tasks with my husband, so that he could assign me tasks like “buy three kitchen sponges”. Ideally, I’d think I’d like to be able to see three task lists: his, mine, and ours.
My husband and I would probably set things up to both have read/write permission on all three — but there are some things that only one of us can or should do. I can imagine other couples might want to not have write permission on each other’s, only on the “ours” one.
10. Make it easy to discuss tasks. This means assigning a simple ID and URL to the task. If Jim and I are going to share tasks, we are going to discuss them. It would be nice to be able to say, “Task #45” instead of “that one about the paintbrushes”. It would also be nice to be able to email a link to him which will take him right to Task #45.
11. (Nice to have) Allow putting a time estimate on the task. If you know that it takes you about two hours to get to your locker, change clothes, stretch, run 2km, stretch, shower, change clothes, and get back to your workplace, then it might be nice to put in an estimate for the “run 2km” task.
If you can put a time estimate on a task and adjust it later, the TDLM could keep track of estimated vs. actual, and start to help you adjust your estimates. “For tasks which you estimate are going to be about 3hrs, you spend an average of 4.15 hrs.”
It would also be nice if the TDLM could help you make estimates based on similar tasks which you completed. When entering an estimate for painting the living room, it would be nice if the TDLM mentioned, off to the side, how long it took you to paint the bathroom and the bedroom. (It’s even okay if it also tells you how long it took you to paint the landscape or your fingernails; presumably you’d be smart enough to figure out which tasks were relevant.)
12. (Nice to have) Make the TDLM geo-aware. It would be kind of nice to be able to hide tasks until I was at or near a particular location. For example, if I am not in a big hurry to paint the bedroom, hide “buy paint” until I am actually at the paint store.
Something requested by the students in the article I mentioned earlier was being told to leave in order to make it to the next appointment. “Doctor’s appointment at 3pm” is a calendar event, but “get to doctor’s office” is a task which needs to happen at a time which depends upon how long it takes to get to the doctor’s office from where you are. That’s another way that geo-awareness could be useful.
13. (Maybe nice to have) Be able to mark urgency. I am not actually certain how useful this is. I have had TDLMs which allowed me to mark urgency, and I found that I almost never used it. I think people will expect it, however.
14. (Nice to have, but difficult) Integrate with my applications. Tasktop Technologies has a product called Tasktop Dev, which kept track of what you did in the source code editor (and some other applications, e.g. web browser and Microsoft Office) while you were working on a specific task. (You had to tell it, “now I am working on task #47” so that it would know to start watching.) Then, there was a record of what you worked on for that task. That was useful if you needed to stop and restart the task (especially over a long period of time), or if you needed to go back a long time later and see what you had done. (“What was the URL of that caterer with the really nice cheesecake?”)
In a work environment, it would be nice to integrate it with other task management systems (AKA “bug trackers”) like Jira or Asana or Bugzilla.
This is what I want. If it persists in not existing, I might have to do it myself someday. (27 July 2020 — I got tired of waiting. I am now developing the perfect to-do list manager, and it has already changed my life.)
Permalink
12.15.13
Posted in Maps at 8:54 pm by ducky
I have developed some maps which show seasonally adjusted unemployment rates, by month, by county, for the past 23 years, as either a cartogram or as a standard mercator projection.
One of the stories that my unemployment map tells clearly is just how bad the financial meltdown in 2008 was, and how sudden.
This might surprise you if you saw the video of unemployment by county by LaToya Egwuekwe which went viral. It is a fine video for what it is, but I think it is slightly misleading.
Her video showed pretty clearly that things started to slide a little bit in late 2008, but the real rise in unemployment hit in 2009, with the worst being in June 2010.

Still from unemployment video by LaToya Egwuekwe
I was quite surprised when I saw this, as it didn’t match what I knew of the situation.
Below is what the national unemployment rate actually looked like over time. (The seasonally adjusted rate is darker; the unadjusted rate is lighter.)
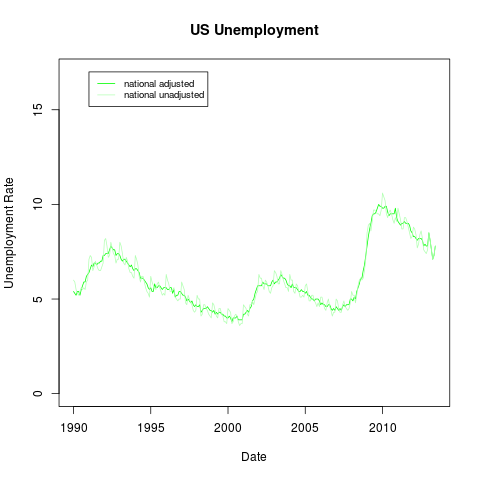
The seasonally adjusted unemployment rate actually peaked in October 2009, not in mid-2010.
Why the difference? If you look at the fine print of Egwuekwe’s video, it is a map of the 12-month rolling average of unemployment, which is a lagging indicator. This means that, for example, in October 2008, right after the financial meltdown, the unemployment numbers she used for the map included November 2007 through September 2007 — which were generally pretty good. Similarly, the unemployment later seemed to be higher than it really was because the rolling average included the previous year — which included very high unemployment.
Here is a comparison of the seasonally adjusted unemployment rate and the 12-month rolling average for 2007 through the present: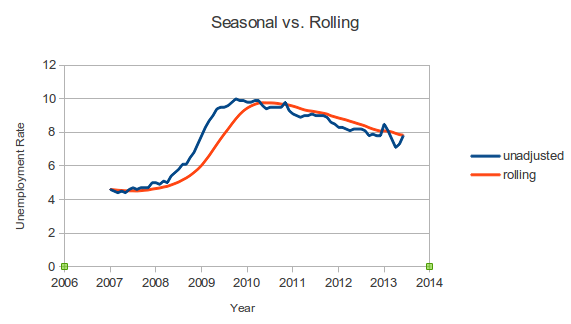
It is perfectly understandable that Ms. Egwuekwe would use the 12-month rolling average instead of the seasonally-adjusted unemployment. Why? Because the Bureau of Labor Statistics does not publish seasonally adjusted unemployment rates at the county level, and it is a royal pain to calculate the seasonally adjusted unemployment for each county individually. (I should know, because I did calculate seasonally adjusted unemployment for each county individually.)
She could have used the unadjusted unemployment rate for a county, but there can be so much seasonal variation that it is hard to see the longer-term trends. This is particularly true in agricultural communities. For example, here is a graph which shows the unadjusted unemployment rate for Clark County, IL in light blue, and the seasonally adjusted rate in darker blue.

(For comparison, the national unemployment rate is in light green.)
Thus, if Ms. Egwuekwe had used the raw unadjusted unemployment numbers for her video, the short-term fluctuations would have made it difficult to see the longer-term trends. It was a reasonable tradeoff to make.
One other complaint I have about maps like hers, and well, almost all thematic maps, is that they give too much visual weight to rural areas compared to urban areas. When you see a map like the one at the top of the post, you probably do sort of a visual averaging to figure out what the overall unemployment is like. However, because there are a huge number of people in cities, and because cities are very small compared to the vast stretches of rural areas, what you see in rural areas dominates the map. A population-based cartogram — where jurisdictions are distorted so that the area of a jurisdiction is proportional to its area — gives a map which is less misleading.
Again, it’s completely understandable that people would normally use maps which show area instead of population. It’s a royal pain to generate a cartogram. (I should know, I did generate cartograms.)
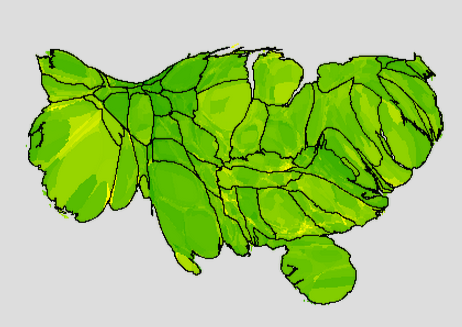
Here is a population-based cartogram of the unemployment in June 2008, before the financial crisis hit, when the US seasonally adjusted unemployment rate was 4.6%:
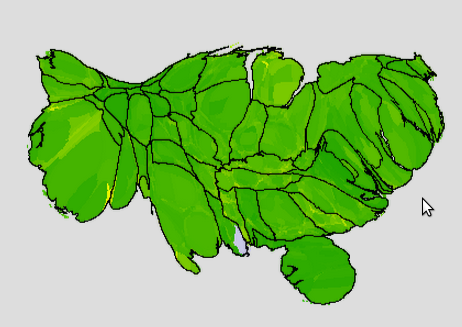
(Green is good; yellow is bad. Full green is 0% unemployment; full yellow is 17% unemployment. States are outlined.)
Now here is an image from the worst month after the financial meltdown, October 2009:
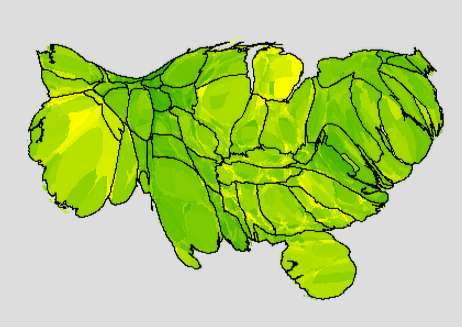
The financial crisis hit fast, and it hit hard.
The good news is that it is getting better. Here is a map of the latest month which I have data for, June 2013:
Note: it is a little difficult to recognize places when they are distorted. On my unemployment maps web page, you can show city names; you can click on a county to get more information about that county.
Permalink
11.17.13
Posted in Maps at 6:35 pm by ducky
When I watched people look at my cartograms, I saw that they frequently had trouble figuring out which distorted shapes on the map corresponded to which shapes on the more familiar non-distorted maps they were familiar with.

Cartogram without labels
Clearly, I needed to give them some reference points.
The first thing that I thought of doing was distorting Open Street Map tiles to match the cartographic distortion. That didn’t work out so well, and I decided that I could get 90% of the benefit just by showing city names.
The next thing I tried was to make tiles with city names on them. This turned out to be difficult because city names frequently crossed tile boundaries, and the city names were variable widths.
What worked: I made markers with custom icons, where the icon was an image of the city name, and placed the icons at the appropriate location on the cartogram. This worked well: the city names moved with the background image when dragged, and creating the custom icons was quite lightweight.
Having solved how to show city names, I then needed to figure out when to show city names. Clearly I should show bigger cities first, but if you zoom in, you want to see smaller cities. I don’t know how Google does it, but they probably can afford to decide on a city-by-city basis at which zoom level that city should appear, but there are an awful lot of cities and an awful lot of zoom levels, and my name’s not Google. I can’t afford to do that.
I experimented with coming up with a formula to specify what population threshold to use for which zoom level, but I was unsatisfied with that. I couldn’t find a formula which would show enough cities in lightly-populated areas but not too many in densely populated areas.
The next thing I tried was to figure out which area of the map was showing, and to label only the top six (by population) visible cities. This means that you see only really big cities when zoomed out a lot:

Six biggest cities labelled
But when you zoom in (or move so that one of the labelled cities stops being in the view), more cities appeared:


(When I did this, I was surprised to find out how small (in population) some major cities are. Jacksonville, FL is bigger than Miami. Indianapolis is bigger than Boston. El Paso is bigger than Seattle. Now, partly that’s because I’m labelling cities and not metro areas, but it still surprised me.)
Even only showing six, there were still times when the cities names got crowded. Also, when way zoomed out, big sections of the country didn’t have any labels. What I finally did was look at the top 23 visible cities, and if there was a larger city nearby (in pixels), I skipped the smaller city. This seems to work really well:


It sure beat keeping a list of which cities to show at which zoom level!
Permalink
11.15.13
Posted in Art, Maps at 10:13 am by ducky
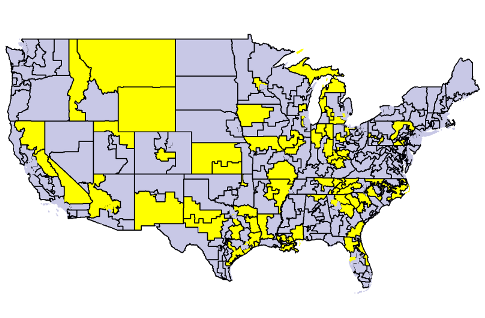
Ryan Lizza posted an article and map in the New York Times which showed the locations of the US Congressional Districts whose Representatives backed the US federal government’s shutdown in an attempt to defund Obamacare. Here is a version of the map which I made, with yellow for the “suicide caucus”:
The article and map were good. I liked them. But there’s a real danger when looking at a map that you will — consciously or unconsciously — mentally equate the relative number of pixels on a map into the relative number of people.
Unfortunately, the geographical distribution of people is wildly, wildly uneven: from 0.04 people per square mile in the Yukon-Koyukuk Borough to more than 70,000 people per square mile in Manhattan. Yes, there are 1.75 MILLION more people per square mile in Manhattan than rural Alaska.
The map above makes it look like a higher percentage of congresspeople supported the shutdown than actually did. If you look at the shutdown districts on a cartogram — a map where the area of a congressional is distorted to be proportional to the population of that district — instead, it becomes even more clear just how few representatives were involved.

I have made a web page where you can explore congressional districts yourself.
In addition to seeing the maps above, you can also see thematic maps (both cartogram and regular) of
- percent without insurance
- percent white
- median family income
- median gross rent
- median home value
- percent living in poverty
- percent of children living in poverty
- percent of elderly living in poverty
- median age
- congressional election results from 2012
Additionally, if you click on a congressional district, you can see who represents that district, plus all of the above values for that district. If you click on the map away from a congressional district, you can see a table comparing the shutdown districts with the non-shutdown districts.
You can also look at maps for the presidential 2012 election results and seasonally-adjusted unemployment, but because those are county-based figures, you can’t do a strict comparison between shutdown/non-shutdown districts, so they aren’t in the comparison table or the per-district summaries.
Implementation notes
I used ScapeToad to generate the cartograms. It was a lot of trial and error to figure out settings which gave good results. (For those of you who want to make cartograms themselves: I defined cartogram parameters manually, and used 6000 points for the first grid, 1024 for the second, and 3 iterations.)
I used QGIS and GRASS to clean it up afterward (to remove slivers and little tiny holes left between the districts sometimes) and to merge congressional districts to make cartogram shapes.
NB: I use the state boundaries which I created by merging the cartogramified congressional districts, even for the maps which are based on counties (e.g. unemployment and the presidential results). It is pretty impressive how well the merged congressional district state boundaries match the county cartogram state borders. It wasn’t at all obvious to me that would happen. You could imagine that ScapeToad might have been more sensitive to the shapes of the counties, but somehow it all worked. Kudos to ScapeToad!
At some zoom levels, not all the district boundaries get drawn. That’s because I don’t want the map to be all boundary when way zoomed out, so I check the size before drawing boundaries. If the jurisdiction is too small, I don’t draw the boundary.
As a starting point, I used the Congressional District shapefiles from the US Census Bureau. For the population used for generating the cartogram, I used the Census Bureau American Community Survey 2011 values. For the other map attributes, I specify the source right under the “Color areas by”.
I made the map tiles myself, using custom PHP code. You can read more about it in Optimizing Map Tile Generation. I came up with my own algorithm for showing city labels.
Permalink
10.06.13
Posted in Random thoughts, Technology trends at 2:11 pm by ducky
I have heard that looking at faces is difficult for people with autism. I don’t understand it, but the impression I gotten from reading descriptions from high-functioning adults that the facial recognition hardware has a bug which causes some sort of feedback loop that is uncomfortable.
What if there was a Google Glasses application which put ovals in front of people’s faces? Blue ovals if they were not looking at you, pink ovals if they are. Maybe a line to show where the center line of their face is.
Maybe that would make it more comfortable to be around collections of people.
Permalink
04.18.13
Posted in Hacking, Maps at 1:20 am by ducky
The Huffington Post made a very nice interactive map of homicides and accidental gun deaths since the shooting at Sandy Hook. It’s a very nice map, but has the (very common problem) that it mostly shows where the population density is high: of course you will have more shootings if there are more people.
I wanted to tease out geographical/political effects from population density effects, so I plotted the gun deaths on a population-based cartogram. Here was my first try. (Click on it to get a bigger image.)

Unfortunately, the Huffington Post data gives the same latitude/longitude for every shooting in the same city. This makes it seem like there are fewer deaths in populated areas than there really are. So for my next pass, I did a relatively simple map where the radius of the dots was proportional to the square root of the number of gun deaths (so that the area of the dot would be proportional to the number of gun deaths).

This also isn’t great. Some of the dots are so big that they obscure other dots, and you can’t tell if all the deaths were in one square block or spread out evenly across an entire county.
For the above map, for New York City, I dug through news articles to find the street address of each shooting and geocoded it (i.e. determined the lat/long of that specific address). You can see that the points in New York City (which is the sort of blobby part of New York State at the south) seem more evenly distributed than for e.g. Baltimore. Had I not done that, there would have been one big red dot centered on Manhattan.
(Side note: It was hugely depressing to read article after article about people’s — usually young men’s — lives getting cut short, usually for stupid, stupid reasons.)
I went through and geocoded many of the cities. I still wasn’t satisfied with how it looked: the size balance between the 1-death and the multiple-death circles looked wrong. It turns out that it is really hard — maybe impossible — to get area equivalence for small dots. The basic problem is that with radiuses are integers, limited by pixels. In order to get the area proportional to gun deaths, you would want the radius to be proportional to the square root of the number of gun deaths, or {1, 1.414, 1.732 2.0, 2.236, 2.449, 2.645, 2.828, 3.000}, the rounded numbers will be {1, 1, 2, 2, 2, 2, 3, 3, 3}; instead of areas of {pi, 2*pi, 3*pi, 4*pi, …}, you get {pi, pi, 4*pi, 4*pi, 4*pi, 9*pi, 9*pi, 9*pi}.
Okay, fine. We can use a trick like anti-aliasing, but for circles: if the square root of the number of gun deaths is between two integer values (e.g. 2.236 is between 2 and 3), draw a solid circle with a radius of the just-smaller integer (for 2.236, use 2), then draw a transparent circle with a radius of the just-higher integer (for 2.236, use 3), with the opacity higher the closer the square root is to the higher number. Sounds great in theory.
In practice, however, things still didn’t look perfect. It turns out that for very small dot sizes, the dots’ approximations to circles is pretty poor. If you actually zoom in and count the pixels, the area in pixels is {5, 13, 37, 57, 89, 118, 165, …} instead of what pi*R^2 would give you, namely {3.1, 12.6, 28.3, 50.3, 78.5, 113.1, 153.9, …}.

But wait, it’s worse: combine the rounding radiuses problem with the problem of approximating circles, and the area in pixels will be {5, 5, 13, 13, 13, 13, 37, 37, 37, …}, for errors of {59.2%, -60.2% -54.0% -74.1% -83.4% -67.3% -76.0%, …}. In other words, the 1-death dot will be too big and the other dots will be too small. Urk.
Using squares is better. You still have the problem of the rounding the radius, but you don’t have the circle approximation problem. So you get areas in pixels of {1, 1, 4, 4, 4, 9, 9, 9, …} instead of {1, 2, 3, 4, 5, 6, 7, 8, …} for errors of {0.0%, -50.0%, 33.3%, 0.0%, -20.0%, -33.3%, 28.6%, …} which is better, but still not great.
Thus: rectangles:

Geocoding provided by GeoCoder.ca
Permalink
03.14.13
Posted in Maps at 12:11 am by ducky
I imagine some epidemiologist somewhere, who has statistics on the something like the measles rate by postal code, who wants to see if there is a geographic trend, like if warmer places have more measles. She has a spreadsheet with the postal codes and the number of cases in that postal code, and wants to turn that into a map where each postal code’s colour represents the number of cases per capita in that postal code.
She should not need to know what a shapefile is, should not need to know that the name of the map type she wants is “choropleth”, and should not have to dig up the population of that postal code. The boundaries of the jurisdictions she cares about (postal codes, in this case) and the population are well-understood and don’t change often; the technology to make such a map out to be invisible to her. She should be able to upload a spreadsheet and get her map.
I find it almost morally wrong that it is so hard to make a map.
Making that possible would be my dream job. It is a small enough job that I could do it all by myself, but it is a large enough job that it would effectively prevent me from doing other paying work for probably about a year, and I can’t see a way to effectively monetize it.
The challenges are not in creating a map that is displayed onscreen — that’s the easy part. To develop this service would require (in order of difficulty):
- code and resources to enable users to store their data and map configurations securely;
- code to pick out jurisdiction names and data columns from spreadsheets, and/or a good UI to walk the user through picking the columns;
- fuzzy matching code which understands that e.g. “PEI” is really “Prince Edward Island”, a province in Canada; that “St John, LA” is actually “Saint John the Baptist Parish”, a county-equivalent in Louisiana; that there are two St. Louis counties in Misouri; that Nunavut didn’t exist before 1999;
- code to allow users to share their data if they so choose;
- UI (and underlying code) to make the shared data discoverable, usable, and combinable;
- code (and perhaps UI) to keep spammers from abusing the system;
- code to generate hardcopy of a user’s map (e.g. PNG or PDF);
- code for a user account mechanism and UI for signing in
This service would give value to many people: sales managers trying to figure out how to allocate sales districts, teachers developing lesson plans about migration of ethnic minorities, public health officials trying to understand risk factors, politicians targeting niche voters, urban planning activists trying to understand land use factors, etc.
Unfortunately, for the people to whom this really matters, if they already have money, they already ponied up the money for an ESRI mapping solution. If they don’t have money, then they won’t pay for this service.
GeoCommons tries to do this. GeoCommons makes maps from users’ data, and you stores and shares users’ data, but their map making is so slow it is basically unusable, and it is not easy to combine data from multiple sources into one map.
It might be that one of the “big data” organizations, e.g. Google or Amazon, might provide this as an enticement for getting people to use their other services. Google, for example, has a limited ability to do this kind of thing with their Fusion Tables (although if you want to do jurisdictions other than countries, then you have to provide a shapefile). Amazon provides a lot of data for use with the Amazon Web Services.
However, it would be almost as difficult for Google or Amazon to monetize this service as it would for me. Google could advertise and Amazon could restrict it to users of its AWS service, but it isn’t clear to me how much money that could bring in.
If anybody does figure out a way to monetize it, or wants to take a gamble on it being possible, please hire me!
Permalink
03.12.13
Posted in Hacking, Maps at 11:54 am by ducky
In the past, when people asked me how I managed to make map tiles so quickly on my World Wide Webfoot Maps site, I just smiled and said, “Cleverness.” I have decided to publish how I optimized my map tile generation in hopes that others can use these insights to make snappier map services. I give a little background of the problem immediately below; mapping people can skip to the technical details.
Background
Choropleth maps colour jurisdictions based on some attribute of the jurisdiction, like population. They are almost always implemented by overlaying tiles (256×256 pixel PNG images) on some mapping framework (like Google Maps).
 |
| Map tile from a choropleth map (showing 2012 US Presidential voting results by county) |
Most web sites with choropleth maps limit the user: users can’t change the colours, and frequently are restricted to a small set of zoom levels. This is because the tiles are so slow to render that the site developers must render the tile images ahead of time and store them. My mapping framework is so fast that I do not need to pre-render all the tiles for each attribute. I can allow the users to interact with the map, going to arbitrary zoom levels and changing the colour mapping.
Similarly, when people draw points on Google Maps, 100 is considered a lot. People have gone to significant lengths to develop several different techniques for clustering markers. By contrast, my code can draw thousands very quickly.
There are 32,038 ZIP codes in my database, and my framework can show a point for each with ease. For example, these tiles were generated at the time this web page loaded them.
 |
| 32,038 zip codes at zoom level 0 (entire world) |
| |
 |
| Zip codes of the Southeast US at zoom level 4 |
(If the images appeared too fast for you to notice, you can watch the generation here and here. If you get excited, you can change size or colour in the URL to convince yourself that the maps framework renders the tile on the fly.)
Technical Details
The quick summary of what I did to optimize the speed of the map tile generation was to pre-calculate the pixel coordinates, pre-render the geometry and add the colours later, and optimize the database. In more detail:
Note that I do NOT use parallelization or fancy hardware. I don’t do this in the cloud with seventy gajillion servers. When I first wrote my code, I was using a shared server on Dreamhost, with a 32-bit processor and operating system. Dreamhost has since upgraded to 64-bits, but I am still using a shared server.
Calculating pixel locations is expensive and frequent
For most mapping applications, buried in the midst of the most commonly-used loop to render points is a very expensive operation: translating from latitude/longitude to pixel coordinates, which almost always means translating to Mercator projection.
While converting from longitude to the x-coordinate in Mercator is computationally inexpensive, to convert from latitude to y-coordinate using the Mercator projection is quite expensive, especially for something which gets executed over and over and over again.
A spherical mercator translation (which is actually much simpler than the actual projection which Google uses) uses one logarithmic function, one trigonometric function, two multiplications, one addition, and some constants which will probably get optimized away by the compiler:
function lat2y(a) { return 180/Math.PI * Math.log(Math.tan(Math.PI/4+a*(Math.PI/180)/2)); }
(From the Open Street Maps wiki page on the Mercator projection)
Using Lists of instruction latencies, throughputs and micro-operation breakdowns for Intel, AMD and VIA CPUs by Agner Fog, I calculated that a tangent can take between 11 and 190 cycles, and a logarithm can take between 10 and 175 cycles on post-Pentium processors. Adds and multiplies are one cycle each, so converting from latitude to y will take between 24 and 368 cycles (not counting latency). The average of those is almost 200 cycles.
And note that you have to do this every single time you do something with a point. Every. Single. Time.
If you use elliptical Mercator instead of spherical Mercator, it is much worse.
Memory is cheap
I avoid this cost by pre-calculating all of the points’ locations in what I call the Vast Coordinate System (VCS for short). The VCS is essentially a pixel space at Google zoom level 23. (The diameter of the Earth is 12,756,200 meters; at zoom level 23, there are 2^23 tiles, and each tile has 256 or 2^8 pixels, so there are 2^31 pixels around the equator. This means that the pixel resolution of this coordinate system is approximately .6cm at the equator, which should be adequate for most mapping applications.)
Because the common mapping frameworks work in powers of two, to get the pixel coordinate (either x or y) at a given zoom level from a VCS coordinate only requires one right-shift (cost: 1 cycle) to adjust for zoom level and one bitwise AND (cost: 1 cycle) to pick off the lowest eight bits. The astute reader will remember that calculating the Mercator latitude takes, for the average post-Pentium processor, around 100 times as many cycles.
Designing my framework around VCS and the Mercator does make it harder to change the projection, but Mercator won: it is what Google uses, what Yahoo uses, what Bing uses, and even what the open-source Leaflet uses. If you want to make map tiles to use with the most common services, you use Mercator.
Furthermore, should I decide that I absolutely have to use a different projection, I would only have to add two columns to my points database table and do a bunch of one-time calculations.
DISTINCT: Draw only one ambiguous point
If you have two points which are only 10 kilometers apart, then when you are zoomed way in, you might see two different pixels for those two points, but when you zoom out, at some point, the two points will merge and you will only see one pixel. Setting up my drawing routine to only draw the pixel once when drawing points is a big optimization in some circumstances.
Because converting from a VCS coordinate to a pixel coordinate is so lightweight, it can be done easily by MySQL, and the DISTINCT keyword can be used to only return one record for each distinct pixel coordinate.
The DISTINCT keyword is not a big win when drawing polygons, but it is a HUGE, enormous win when drawing points. Drawing points is FAST when I use the DISTINCT keyword, as shown above.
For polygons, you don’t actually want to remove all but one of a given point (as the DISTINCT keyword would do), you want to not draw two successive points that are the same. Doing so is a medium win (shaving about 25% of the time off) for polygon drawing when way zoomed out, but not much of a win when way zoomed in.
Skeletons: Changing the colour palette
While the VCS speed improvement means that I could render most tiles in real time, I still could not render tiles fast enough for a good user experience when the tiles had very large numbers of points. For example, the 2000 Census has 65,322 census tracts; at zoom level 0, that was too many to render fast enough.
Instead, I rendered and saved the geometry into “skeletons”, with one set of skeletons for each jurisdiction type (e.g. census tract, state/province, country, county). Instead of the final colour, I filled the polygons in the skeleton with an ID for the particular jurisdiction corresponding to that polygon. When someone asked for a map showing a particular attribute (e.g. population) and colour mapping, the code would retrieve (or generate) the skeleton, look up each element in the colour palette, decode the jurisdictionId, look up the attribute value for that jurisdictionId (e.g. what is the population for Illinois?), use the colour mapping to get the correct RGBA colour, and write that back to the colour palette. When all the colour palette entries had been updated, I gave it to the requesting browser as a PNG.
While I came up with the idea of fiddling the colour palette independently, it is not unique to me. A friend also came up with this idea independently, for example. What I did was take it a bit farther: I modified the gd libraries so they had a 16-bit colour palette in the skeletons which I wrote to disk. When writing out to PNG, however, my framework uses the standard format. I then created a custom version of PHP which statically linked my custom GD libraries.
(Some people have asked why I didn’t contribute my changes back to gd. It’s because the pieces I changed were of almost zero value to anyone else, while very far-reaching. I knew from testing that my changes didn’t break anything that I needed, but GD has many many features, and I couldn’t be sure that I could make changes in such a fundamental piece of the architecture without causing bugs in far-flung places without way more effort than I was willing to invest.)
More than 64K jurisdictions
16 bits of palette works fine if you have fewer than 64K jurisdictions on a tile (which the 2000 US Census Tract count just barely slid under), but not if you have more than 64K jurisdictions. (At least not with the gd libraries, which don’t reuse a colour palette entry if that colour gets completely overwritten in the image.)
You can instead walk through all the pixels in a skeleton, decode the jurisdiction ID from the pixel colour and rewrite that pixel instead of walking the colour palette. (You need to use a true-colour image if you do that, obviously.) For large numbers of colours, changing the colour palette is no faster than walking the skeleton; it is only a win for small numbers of colours. If you are starting from scratch, it is probably not worth the headache of modifying the graphics library and statically linking in a custom version of GD into PHP to walk the colour palette instead of walking the true-colour pixels.
(I had to modify GD anyway due to a bug I fixed in GD which didn’t get incorporated into the GD release for a very long time. My patch finally got rolled in, so you don’t need to do that yourself.)
My framework now checks to see how many jurisdiction are in the area of interest; if there are more than 64K, it creates a true-colour image, otherwise a paletted image. If the skeleton is true-colour, it walks pixels, otherwise it walks the palette.
Credits: My husband implemented the pixel-walking code.
On-demand skeleton rendering
While I did pre-render about 10-40 tiles per jurisdiction type, I did not render skeletons for the vast majority of tiles. Instead, I render and save a skeleton only when someone asks for it. I saw no sense in rendering ahead of time a high-maginification tile of a rural area. Note that I could only do this on-demand skeleton generation because the VCS speedup made it so fast.
I will also admit that I did generate final tiles (with the colour properly filled in, not a skeleton) to zoom level 8 for some of my most commonly viewed census tract attributes (e.g. population by census tract) with the default value for the colour mapping. I had noticed that people almost never change the colour mapping. I did not need to do this; the performance was acceptable without doing so. It did make things slightly snappier, but mostly it just seemed to me like a waste to repeatedly generate the same tiles. I only did this for US and Australian census jurisdictions.
MySQL vs. PostGIS
One happy sort-of accident is that my ISP, Dreamhost, provides MySQL but does not allow PostGIS. I could have found myself a different ISP, but I was happy with Dreamhost, Dreamhost was cheap, and I didn’t particularly want to change ISPs. This meant that I had to roll my own tools instead of relying upon the more fully-featured PostGiS.
MySQL is kind of crummy for GIS. Its union and intersection operators, for example, use bounding boxes instead of the full polygon. However, if I worked around that, I found that for what I needed to do, MySQL was actually faster (perhaps because it wasn’t paying the overhead of GIS functions that I didn’t need).
PostGIS’ geometries are apparently stored as serialized binary objects, which means that you have to pay the cost of deserializing the object every time you want to look it or one of its constituent elements. I have a table of points, a table of polygons, and a table of jurisdictionIds; I just ask for the points, no deserialization needed. Furthermore, at the time I developed my framework, there weren’t good PHP libraries for deserializing WKB objects, so I would have had to write my own.
Note: not having to deserialize is only a minor win. For most people, the convenience of the PostGIS functions should be worth the small speed penalty.
Database optimization
One thing that I did that was entirely non-sexy was optimizing the MySQL database. Basically, I figured out where there should be indices and put them there. This sped up the code significantly, but it did not take cleverness, just doggedness. There are many other sites which discuss MySQL optimization, so I won’t go into that here.
Future work: Feature-based maps
My framework is optimized for making polygons, but it should be possible to render features very quickly as well. It should be possible to, say, decide to show roads in green, not show mountain elevation, show cities in yellow, and not show city names.
To do this, make a true-colour skeleton where each bit of the pixel’s colour corresponds to the display of a feature. For example, set the least significant bit to 1 if a road is in that pixel. Set the next bit to 1 if there is a city there. Set the next bit to 1 if a city name is displayed there. Set the next bit to 1 if the elevation is 0-500m. Set the next bit to 1 if the elevation is 500m-1000m. Etc. You then have 32 feature elements
which you can turn on and off by adjusting your colour mapping function.
If you need more than 32 feature elements, then you could use two skeletons and merge the images after you do the colour substitutions.
You could also, if you chose, store elevation (or depth) in the pixel, and adjust the colouring of the elevation with your colour mapping function.
Addendum: I meant to mention, but forgot, UTFGrid. UTFGrid has an array backing the tile for lookup of features, so it is almost there. However, it is just used to make pop-up windows, not (as near as I can tell) to colour polygons.
Permalink
02.01.13
Posted in Consumer advice at 2:24 pm by ducky
I recently moved, and (because I injured my shoulder and because we are slowly facing up to the fact that we are not 25 any more) we hired packers and movers. We had a lot of boxes, but not enough, and the packers expressed a strong desire to use Frogbox boxes.
I had heard of Frogbox before, but hadn’t really found their service compelling. The boxes looked really big and heavy, in addition to being expensive compared to scrounging boxes from here and there.
What I didn’t understand is that movers and packers absolutely love the boxes. Because all the boxes are a standard size, loading the truck becomes less like a cross between Tetris and Operation and more stacking Mac&Cheese boxes on grocery store shelves.
Because the boxes are very sturdy, they minimize risk, especially for the movers. The bottom isn’t going to fall out of one of the boxes; one box in a stack isn’t going to collapse asymmetrically and tip over the whole stack.
They are big and heavy enough that desk jockeys who are ferrying boxes in their car and then carrying them up stairs aren’t going to like them, but for muscular movers with the right trucks, dollies, and lift gates, they aren’t a real problem (especially if there are elevators instead of stairs).
If you filled them up entirely with books, they would be too heavy for the packers to move easily, but a) I don’t think the packers would do that and b) the packers generally didn’t move the boxes. A packer would set an empty Frogbox in one spot, fill it, close the lids, put an empty Frogbox on top of the first, and proceed to load the second. We ended up with short towers of Frogboxes scattered around our apartment.
The packers did not need to spend time converting flattened boxes into 3D boxes or to tape the boxes shut. This, in turn, meant that they spent no time looking for their tape pistols (or, on the other side, box cutters).
It didn’t seem to me like the lids closed really securely, but it turns out that doesn’t matter: the weight of the box above holds it down, and the lids are heavy enough that unless you are moving in hurricane-force winds, they aren’t going to open by themselves. (And if you are trying to move in a hurricane, you’ve got bigger problems.) The boxes are also shaped to be wider at the top than bottom, which would rather discourage anyone from trying to load them in any manner besides flap-side-up.
I believe there are cheaper ways to get boxes — scavenge from liquor stores, get the ones from your mother’s basement or your company’s loading dock. However, the overall cost might end up being lower with Frogbox because the movers and packers will work a little more quickly and you will have slightly less risk of damage to the contents.
I think that Frogbox is going to do very well as a company. The only thing I can think of that would get in their way is bedbugs. If it turns out that Frogboxes are a vector for bedbugs, then they would need to hose down the boxes after every use, which would increase costs. Yes, there might be bugs in the boxes you get from the liquor store or even from your mother’s garage, but cardboard boxes probably have fewer users.
the bottom isn’t going to fall out of one of the boxes.
Permalink
« Previous Page — « Previous entries « Previous Page · Next Page » Next entries » — Next Page »

